The Science of VFP™
VFP™ is an educational tool to assist health and fitness professionals in demonstrating physiological changes that occur with proper nutrition and exercise. The product is based on scientific studies and widely accepted research. The physiological principles that hold true for all humans are illustrated throughout the Visual Fitness Planner. However, there are individual physiological principles that are unique to each human and cannot specifically be represented within the Visual Fitness Planner.
The health risk portion of VFP™ is based on the seven risk factors identified by the American Medical Association, the American Dietetic Association, and the American Heart Association. The seven risk factors are as follows:
- Age
- Family History
- Activity Level
- Smoking
- High Blood Pressure
- High Cholesterol
- Body Mass Index
These seven risk factors were studied as factors contributing to diabetes, heart disease, and stroke. The Journal of American Medical Association published the Framingham Study, which followed 10,000 Americans and how their chances for developing diabetes, heart disease, and stroke significantly increased based upon their personal risk factors. The Framingham Study also followed these 10,000 Americans for more than a decade, and showed that by decreasing Body Mass Index (BMI) by 10 percent, an individual’s risks for diabetes, heart disease, and stroke collectively fell 40 percent. A study performed by the Cooper Institute for Aerobics Research also showed that an increased activity rate of prescribed 20 minutes of exercise four times a week resulted in a decrease in risk factors by 10 percent.
- The American Heart Association has published studies stating that decreasing smoking in the first year of prescribed program decreases chances for heart disease and stroke by 10 percent.
- The American Heart Association studies also show that a decrease in blood pressure and cholesterol to within normal rates decrease an individual’s chance for developing heart disease and stroke by 10 percent.
- The American Dietetic Association and the American Medical Association both have published statements addressing BMI as the greatest risk factor of the seven.
The Results Prediction Simulator as part of VFP™ is based on the following:
- Proper Food Intake is based on an individual’s Basal Metabolic Rate (BMR), calculated using the Harris Benedict Equation. Once an individual’s BMR is calculated, their number of days of compliance under the nutritional program is entered. The nutritional plan is based on the American Diabetic Association’s recommendation of 5 to 6 small meals a day. The plan also recommends low-glycemic foods, lean proteins, and small quantities of fat. The combination of food items produces a 500-calorie per day deficit from the individual’s BMR.
- Resistance Training is based on the number of days compliant and simply assigned a moderate value of exercise for 20 minutes. The caloric value assigned to resistance training is 200 calories a day.
- Cardiovascular Training is based on the number of days compliant and assigned a moderate intensity of exercise for a 20 minute session.
- Pounds of fat burned per week is a calculation utilizing the number of days compliant multiplied by the calories burned in each individual category of nutrition, resistance, cardiovascular, and supplements. Total calories saved or burned per week are then calculated.
- Pounds of fat burned are calculated by taking the pounds of fat per week multiplied by the number of weeks compliant to the program.
- The standard weight range utilized by the program to illustrate body transformation from weight is based on the mortality scales created by the insurance industry. Supporting data was also used from the study conducted by the United States Air Force. Both studies provide height and weight recommendations based on mortality.
- Body fat is the estimation of height and weight charts of an average weight person for that age. If a more accurate means of body fat calculation is available, that data can be entered for a more accurate depiction of the individual’s fat to muscle ratio.
The representation of the before and after picture is calculated using the circumference and girth measurements taken from a study performed by the United States Air Force measuring decreased circumference and girth in pilots who had gone through training.
The transformation plan is a combination of well-known fitness and wellness recommendations from such organizations as American Dietetic Association, American College of Sports Medicine, Yale University, and American Heart Association. These recommendations include:
- Reward yourself
- Start today
- Create a new metabolism (smaller more frequent meals)
- Resize your meals
- Cardiovascular train first in the morning
- Resistance train
- Keep a journal on goal setting
- Plan ahead
- Increase water intake
- Intake complex carbohydrates
- Intake lean proteins
Overview of Calculations
Health Age
Solid principles and research were used to create the Health Age component of the VFP™. Health Age is an individual’s actual age and his or her lifestyle risk factors calculated together to produce one’s health age. Health is an age indicator of a person’s likelihood of contracting heart disease, diabetes, stroke and cancer prematurely and is calculated by an individual’s seven health risks: age, BMI, family history, exercise level, high blood pressure, high cholesterol and smoking.
Each one of the seven health risks are given an appropriate weight and value as determined by the medical research. Each value of the health risks was weighted to have a positive or negative effect on an individual’s health age. This tool was constructed with the intention of motivating people to make healthy lifestyle choices while giving them a realistic view of how their lifestyle choices affect their likelihood of contracting of four major diseases.
VFP Disease Risk Calculations
The subject’s BMI is displayed with a vertical progress bar. The range of the BMI bar is 18 to 40. Disease risk factors are also displayed with vertical progress bars. These bars have a range of 0 to 100. The level of risk is expressed by a value between 0 and 100. The calculated risk values are based on assumptions about the relative importance of several well known risk factors. The estimates of the magnitudes of each risk factor attempt to capture the prevailing wisdom about Type II Diabetes, Cardiovascular Heart Disease, and Stroke.
Obesity Factor Calculations
The Obesity factor is a combination of a person’s BMI and a measure of their excess body fat. Excess body fat depends on a person’s age and gender. The obesity factor is calculated using Body Mass Index, acceptable level of body fat based on age and gender and percentage of excess body fat as variables. The calculated resulted is then scaled effectively adjusting the calculated risks for athletes and others with a low percentage of body fat. If the BMI effect is a proxy for the amount of body fat a person carries, then if the person’s body fat is known to be lower, the effect of this factor should be smaller. For example, using this scaling function, the Obesity factor for a person with 7% body fat would be scaled to zero. However, the Obesity factor of a person with 32% body fat would be scaled by 100%.
Diabetes Risk Calculation
A person’s risk of Type II Diabetes is determined by calculated values based on several factors: family history, current exercise activity, age, gender, weight, height, and body composition. The series of formulas are scaled to adjust for levels of obesity. The result is categorized into 6 levels or risk: minimal, low, moderate, high, very high and extremely high risk.
Heart Disease Risk Calculation
Coronary Heart Disease Risk is the sum of nine factors: age, family history, gender, smoking, high blood pressure, exercise history, high cholesterol, BMI, and body fat percentage. The result of the calculation is scaled based on obesity factors and categorized into 6 levels of risk.
Stroke Risk Calculation
Stroke Risk is calculated using the following information: age, family history or stroke, family history of diabetes, smoking habits, gender, blood pressure, exercise history, cholesterol level, height, weight and body composition. The resulting risk value is then scaled and corresponds six categories of risk.
Quantifying a person’s risk with a number does not imply their actual risk – only the risk could be higher or lower if certain factors were different. The main objective of these calculations is to dramatically demonstrate how behaviors increase disease risk while others reduce a person’s risk.
VFP Science Research Calculations
VFP Disease Risk Calculations
The subject’s BMI is displayed with a vertical progress bar. The range of the BMI bar is 18 to 40. Disease risk factors are also displayed with vertical progress bars. These bars have a range of 0 to 100. The level of risk is expressed by a value between 0 and 100. The calculated risk values are based on assumptions about the relative importance of several well known risk factors. The estimates of the magnitudes of each risk factor attempt to capture the prevailing wisdom about Type II Diabetes, Cardiovascular Heart Disease, and Stroke. Please note that quantifying a person’s risk with a number does not imply their actual risk – only that their risk could be higher or lower if certain factors were different. The main objective of these calculations is to dramatically demonstrate how some behaviors increase disease risk while others reduce a person’s risk.
Obesity Factor Calculations
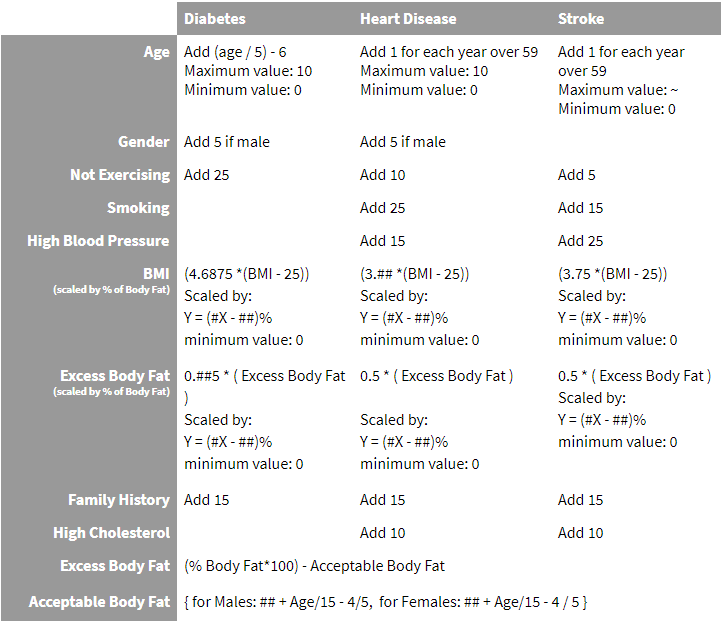
The disease risk calculations take into account the effects of body mass and body fat percentage on a person’s health. The Obesity factor is a combination of a person’s BMI and a measure of their excess body fat. Excess body fat depends on a person’s age and gender. To understand how excess body fat is determined, consider this table which shows an acceptable amount of body fat for persons of various ages:
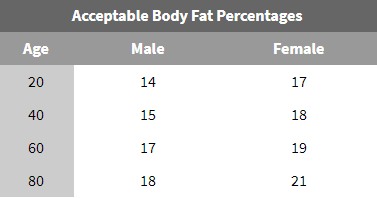
To determine the excess body fat, subtract the acceptable body fat percentage from the person’s actual body fat percentage.
The Obesity Factor is constructed from these basic functions: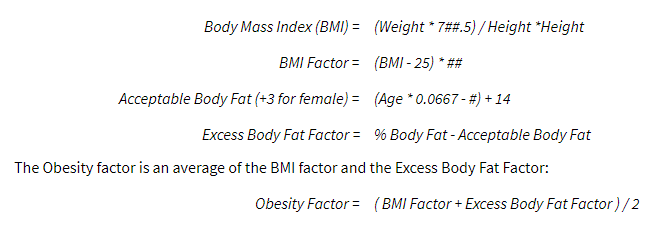
Constructing the Obesity factor in this way allows the Visual Fitness Planner to use the power of BMI to predict disease while also taking into account the effect of a high body fat percentage. The Obesity Factor is scaled by the function:
Y = 0.0#x – 0.##
This scaling function effectively lowers the calculated risks for athletes and others with a low percentage of body fat. If the BMI effect is a proxy for the amount of body fat a person carries, then if the person’s body fat is known to be lower, the effect of this factor should be smaller. For example, using this scaling function, the Obesity factor for a person with 7% body fat would be scaled to 0. However, the Obesity factor of a person with 32% body fat would be scaled by 100%.
Diabetes Risk Calculation
A person’s risk of Type II Diabetes is the sum of six factors: family history, exercise, age, gender, BMI, and Percent Body Fat.
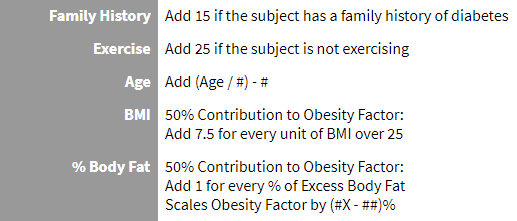
*The Obesity Factor is magnified by 25% for Type II Diabetes
Example:
Consider a female subject 5 ft 6 in, 175 lbs, 36 years old who has a family history of diabetes. She does not exercise. Her BMI is 28.3. Her Body Fat is 35%.
Her risk of Diabetes is: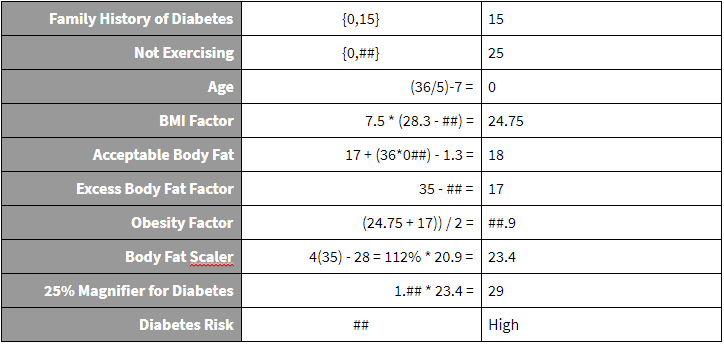

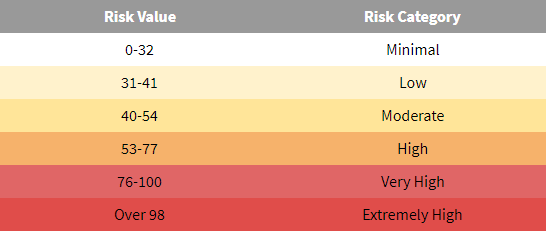
A value of ## places the subject in the ‘High’ Risk category. Risk factor categories for all diseases are as follows:
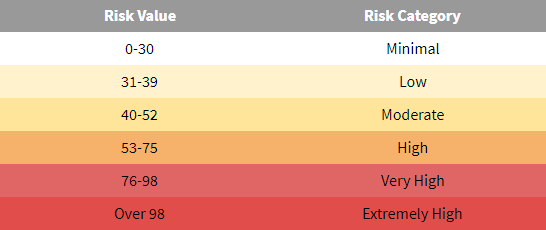 These risk categories correspond to the BMI disease risk levels.
Heart Disease Risk Calculation
Coronary Heart Disease Risk is the sum of nine factors: age, family history, gender, smoking, high blood pressure, exercise, high cholesterol, BMI, and body fat percentage.
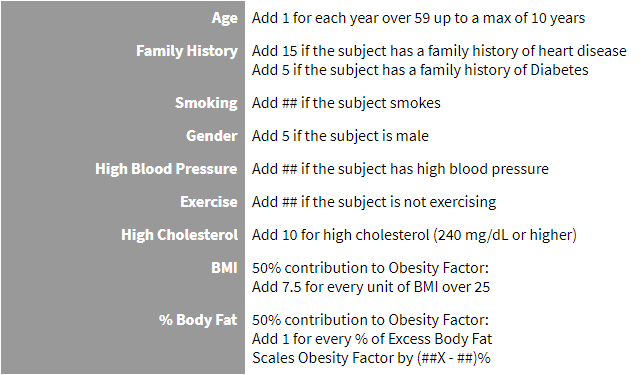
Example:
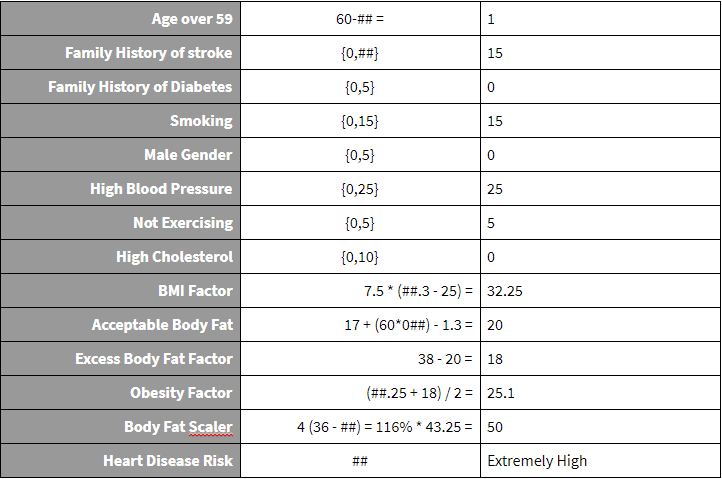
Consider a male subject 6 ft, 250 lbs, 62 years old who smokes and has a family history of heart disease. He does not have High Blood Pressure or High Cholesterol. His BMI is 34.0. His Body Fat is 36%.
His risk of heart disease is:

A value of ## places the subject in the ‘Very High’ Risk category. Risk factor categories for all diseases are as follows:
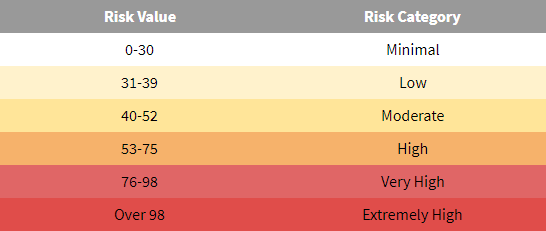
These risk categories correspond to the BMI disease risk levels.
Stroke Risk Calculation
Stroke Risk is the sum of eight factors: age, family history, gender, smoking, high blood pressure, exercise, BMI, high cholesterol.
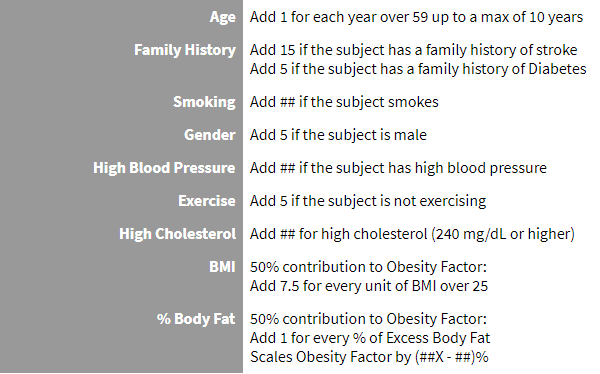
Example:
Consider a female subject 5 ft 3 in, 165 lbs, 60 years old who smokes, has High Blood Pressure, is physically inactive, and has a family history of stroke. Her BMI is 29.3. Her Body Fat is 38%.
Her risk of stroke is:
A value of ## places the subject in the ‘Very High’ Risk category. Risk factor categories for all diseases are as follows:
These values correspond to the BMI disease risk levels.
Disease Risk Factors
Cancer Addendum
Relative Risk of Cancer on a scale of 100 is calculated as follows. First, consider the relationship between a person’s BMI and their risk of Cancer.
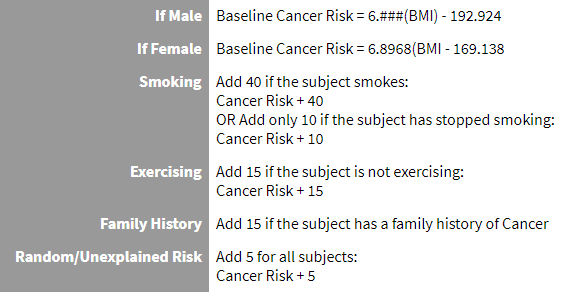
# Please contact your VFP Representative for exact numerical value and further explanation.
References and Notes
J. T. Fine, G. A. Colditz, E. H. Coakley, G. Moseley, J. E. Manson, W. C. Willett, and I. Kawachi. A Prospective Study of Weight Change and Health-Related Quality of Life in Women. JAMA. 1999; 282: 2136-2142.
Body fat: is the estimation of height and weight charts of an average weight person for that age. If a more accurate means of body fat calculation is available, that data can be entered for a more accurate depiction of the individual’s fat to muscle ratio.
The representation of the before and after picture is calculated using the circumference and girth measurements taken from a study performed measuring decreased circumference and girth in older women who had gone through training.
A. R. Folsom, S. A. Kaye, T. A. Sellers, C. P. Hong, J. R. Cerhan, J. D. Potter, and R. J. Prineas. Body fat distribution and 5-year risk of death in older women. JAMA. 1993; 269: 483-487.
A. Wirth and J. Krause. Long-term Weight Loss With Sibutramine: A Randomized Controlled Trial. JAMA. 2001; 286: 1331-1339.
R. B. D’Agostino, Sr, S. Grundy, L. M. Sullivan, P. Wilson, and for the CHD Risk Prediction Group. Validation of the Framingham Coronary Heart Disease Prediction Scores: Results of a Multiple Ethnic Groups Investigation. JAMA. 2001; 286: 180-187.
D. B. Allison, PhD; K. R. Fontaine, PhD; J. E. Manson, MD, DrPH; J. Stevens, PhD; T. B. VanItallie, MD. Annual Deaths Attributable to Obesity in the United States. JAMA. 1999; 282:1530-1538.
M. Wei, J. B. Kampert, C. E. Barlow, M. Z. Nichaman, L. W. Gibbons, R. S. Paffenbarger, Jr, and S. N. Blair. Relationship Between Low Cardiorespiratory Fitness and Mortality in Normal-Weight, Overweight, and Obese Men. JAMA. 1999; 282: 1547-1553.
A. L. Dunn, B. H. Marcus, J. B. Kampert, M. E. Garcia, H. W. Kohl III, and S. N. Blair. Comparison of Lifestyle and Structured Interventions to Increase Physical Activity and Cardiorespiratory Fitness: A Randomized Trial. JAMA. 1999; 281: 327-334.
A. Hinderliter, A. Sherwood, E. C. D. Gullette, M. Babyak, R. Waugh, A. Georgiades, and J. A. Blumenthal. Reduction of Left Ventricular Hypertrophy After Exercise and Weight Loss in Overweight Patients With Mild Hypertension. Archives of Internal Medicine. 2002; 162: 1333-1339.
K. J. Stewart. Exercise Training and the Cardiovascular Consequences of Type 2 Diabetes and Hypertension: Plausible Mechanisms for Improving Cardiovascular Health. JAMA. 2002; 288: 1622-1631.
M. Tanasescu, M. F. Leitzmann, E. B. Rimm, W. C. Willett, M. J. Stampfer, and F. B. Hu. Exercise Type and Intensity in Relation to Coronary Heart Disease in Men. JAMA. 2002; 288: 1994-2000.
D. R. Jacobs, Jr, H. Adachi, I. Mulder, D. Kromhout, A. Menotti, A. Nissinen, H. Blackburn, and for the Seven Countries Study Group. Cigarette Smoking and Mortality Risk: Twenty-five–Year Follow-up of the Seven Countries Study. Archives of Internal Medicine. 1999; 159: 733-740.
W. K. Al-Delaimy, J. E. Manson, C. G. Solomon, I. Kawachi, M. J. Stampfer, W. C. Willett, and F. B. Hu. Smoking and Risk of Coronary Heart Disease Among Women With Type 2 Diabetes Mellitus. Archives of Internal Medicine. 2002; 162: 273-279.
T. Kurth, J. M. Gaziano, K. Berger, C. S. Kase, K. M. Rexrode, N. R. Cook, J. E. Buring, and J. E. Manson. Body Mass Index and the Risk of Stroke in Men. Archives of Internal Medicine. 2002; 162: 2557-2562.
P. W. F. Wilson, R. B. D’Agostino, L. Sullivan, H. Parise, and W. B. Kannel. Overweight and Obesity as Determinants of Cardiovascular Risk: The Framingham Experience. Archives of Internal Medicine. 2002; 162: 1867-1872.
K. R. Fontaine, D. T. Redden, C. Wang, A. O. Westfall, and D. B. Allison. Years of Life Lost Due to Obesity. JAMA. 2003; 289: 187-193.
T. Kurth, J. M. Gaziano, K. Berger, C. S. Kase, K. M. Rexrode, N. R. Cook, J. E. Buring, and J. E. Manson. Body Mass Index and the Risk of Stroke in Men. Archives of Internal Medicine. 2002; 162: 2557-2562.
National Task Force on the Prevention and Treatment of Obesity. Overweight, Obesity, and Health Risk. Archives of Internal Medicine. 2000; 160: 898-904.
R. S. Vasan, A. Beiser, S. Seshadri, M. G. Larson, W. B. Kannel, R. B. D’Agostino, and D. Levy. Residual Lifetime Risk for Developing Hypertension in Middle-aged Women and Men: The Framingham Heart Study. JAMA. 2002; 287: 1003-1010.
B. M. Psaty, C. D. Furberg, L. H. Kuller, M. Cushman, P. J. Savage, D. Levine, D. H. O’Leary, R. N. Bryan, M. Anderson, and T. Lumley. Association Between Blood Pressure Level and the Risk of Myocardial Infarction, Stroke, and Total Mortality: The Cardiovascular Health Study. Archives of Internal Medicine. 2001; 161: 1183-1192.
J. A. Metz, J. S. Stern, P. Kris-Etherton, M. E. Reusser, C. D. Morris, D. C. Hatton, S. Oparil, R. B. Haynes, L. M. Resnick, F. Xavier Pi-Sunyer, S. Clark, L. Chester, M. McMahon, G. W. Snyder, and D. A. McCarron. A Randomized Trial of Improved Weight Loss With a Prepared Meal Plan in Overweight and Obese Patients: Impact on Cardiovascular Risk Reduction. Archives of Internal Medicine. 2000; 160: 2150-2158.